Wing data
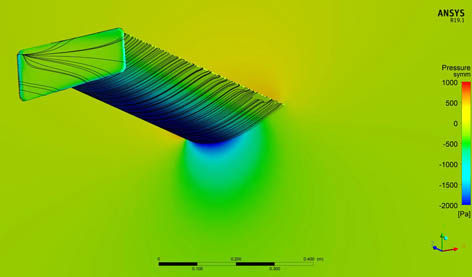
The use of CFD software has enabled mapping of our wing designs in a 'virtual wind tunnel' environment to enable comparisons of the relative levels of downforce and drag within our range of wings. We have also validated the performance of many of our wing combinations in the MIRA full-scale wind tunnel.
The computational analysis has been carried out on 3D CAD models of the wings typically at 1700mm span on rear wings and 1500mm span on front wings. The wings were tested in isolation so the data here should not be regarded as what might be obtained on a car, especially with rear wings, which have the rest of the car ahead of them to compromise the airflow! The data is purely for comparisons between our different wing configurations.
Detailed mapping has been carried out on selected single-element rear and dual-element rear wings and on single-element and dual-element front wing combinations.

It's important to note that different CFD 'codes' and different CFD parameters will generate different results, even on the same wing, so beware of comparing our CFD data with wing data from elsewhere, and vice versa. Such data, ours included, should only be used for comparisons where the same CFD software and settings were used. However, we have been able to map some of our competitors' profiles, and as such we know that our designs offer highly competitive levels of performance, whether you are seeking maximum downforce or maximum efficiency.
Wing data
Our rear wing data plots show the range of performance covered by the profiles mentioned here, all at 1700mm spans.
To obtain approximations of drag and downforce at other spans, simply multiply the forces tabulated and plotted here by the ratio of the span you are interested e.g. for 1000mm span data, multiply by 1000/1700.
For different speeds, multiply downforce by the ratio of the speeds squared, e,g for 75mph, multiply by (75/100)^2 or (75/100) x (75/100).
NB power absorption is proportional to the cube of the speed so in this case, at e.g. 75mph, multiply by (75/100)^3.
Our front wing data show the comparisons between our single-element and dual-element front wings, based on our SM1425 main element profile, at 1500mm span. Once again approximate values for downforce at different spans and speeds can be worked out as described above.
Please contact us if you cannot find or calculate the data you need here.